
By Matthieu Caillaud · Founder, oceanographer
An optimized route shown on its own, for a single crossing, proves nothing — it may simply have been favored by that day's weather. What a routing strategy is worth shows up in an envelope of departures, benchmarked against two references, not one. Here is the study: 28 winter departures Rotterdam–New York, an A* routing engine compared against the theoretically shortest route and against the route the fleet actually sails in winter.
The protocol: 28 departures, not one crossing
We computed the minimum-time route (minimum-time policy) for a 13-knot HFO-powered cargo vessel, baseline consumption 22 t/day, across 28 exploitable departure dates between February 15 and March 15, 2024, in both directions of the Rotterdam–New York crossing. The forcing is historical reanalysis: wind and waves from ERA5, currents from CMEMS. The routing itself uses an A* algorithm exploring the route × speed search space under this forcing.
Twenty-eight departures rather than one, because a route optimized for a single date is an artifact of that day's weather. The useful object is not "the best route" — it is the distribution of gains across a full winter, with its median and P10/P90 bounds — what an operator can actually expect, not what happened once.
Two baselines, not one
Comparing an optimized route only against the great-circle route — the theoretical shortest path, arcing up to 54°N — artificially flatters the result: no vessel sails the great circle in winter North Atlantic conditions, the sea state is too severe there. We therefore add a second, operationally honest baseline: the modal corridor, the route the fleet actually sails in winter, extracted from GMTDS traffic density 2011–2024 (1 km² monthly grid, ridge extracted by a Viterbi algorithm maximizing cumulative density). This corridor stays south of the great circle and is 6.8% longer, +212 nm. It does not represent any single operator's route — it is a traffic-density ridge aggregated over thirteen winters.
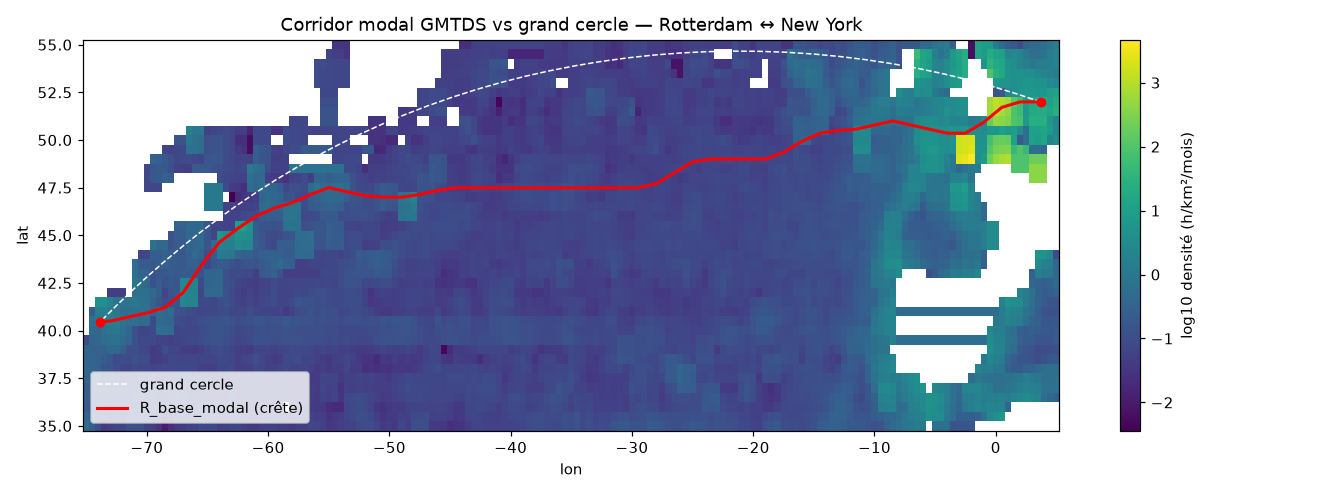
These two baselines bound how the results should be read: the great circle is the theoretical lower bound, never sailable as-is in winter; the modal corridor is the real operational bound, the one an optimized routing strategy actually needs to beat.
Results without a seakeeping penalty
Without a seakeeping penalty, the optimized route R_opt gains time against both baselines, but not fuel against both:
- Westbound, vs modal corridor
- +88 h [+67/+108] (P50 [P10/P90]), fuel saved +22.5 t.
- Westbound, vs great circle
- +14 h [−13/+28]. Absolute medians: R_opt 3,348 nm / 360 h / 252 t; great circle 3,144 nm / 394 h / 244 t; modal corridor 3,356 nm / 444 h / 269 t.
- Eastbound, vs modal corridor
- +82 h [+65/+109], fuel saved +22.8 t.
- Eastbound, vs great circle
- +19 h [−2/+36].
Against the modal corridor, the gain is clear and holds across all three axes — time, fuel, CO₂. Against the great circle, the picture is more nuanced: R_opt is still faster in median terms, but burns slightly more fuel (252 t versus 244 t). The great circle is short and direct; matching its distance without paying for route comfort costs a few tons. That is the honest result, and it depends entirely on which baseline is chosen — which is why we publish both.
With a seakeeping penalty: time yes, safety no
Turning on a seakeeping penalty in the optimization changes the trade-off: against the great circle, R_opt becomes slower in median terms (−31 h westbound, −26 h eastbound) — the detour to avoid the roughest seas costs time. But R_opt stays ahead of the modal corridor, the real operational baseline: +42 h westbound, +33 h eastbound.
The most useful result of this study, however, is negative. The avoided-risk metric — the reduction in vertical-acceleration exposure the optimized route would deliver relative to both baselines — is close to zero: −0.007 westbound, −0.003 eastbound. The reason is structural: vertical acceleration saturates on 22 of 28 dates, on both routes. Winter exposure in the North Atlantic is structurally unavoidable on this corridor; routing does not reduce seakeeping risk, it reduces crossing time. Those are two different benefits, and conflating them would oversell a promise the data does not support.
What this study does not say
Three limits, worth reading before any operational use of the result:
- The study is bounded by the available reanalysis: the currents archive ends in December 2025, which fixes the study window to winter 2024 rather than the most recent winter.
- "Seakeeping non-blocking" is an occurrence statistic over 28 dates, not a regulatory operational safety validation — it does not replace a seakeeping study dedicated to a specific vessel and loading condition.
- Per-leg attribution of the gain — the share due to route choice versus the share due to speed strategy — is not yet decomposed here and remains future work.
The main takeaway fits in one sentence: an envelope over 28 departures, with two baselines and published P10/P90 bounds, is worth more than a single route cherry-picked after the fact — and the result that matters most is sometimes the one that says no. Here, routing buys time; it does not buy additional safety margin on this corridor in winter.
Do you operate a transatlantic route or evaluate a winter liner service? Discover SeaRoute-Py, our A* weather routing engine, or get in touch for an envelope study on your own corridor.
Sources and references
The metrics, comparisons and maps specific to this article are OceanData Consulting results and calculations; the links below document the datasets, standards and publications used.
Facing a similar modeling or metocean data challenge?
From physical model calibration to operational AI post-processing, we help turn marine observations into validated, decision-ready forecasts.
Frequently asked questions
Why benchmark optimized routing against two baseline routes instead of one?
The great circle is the theoretical shortest path but is never sailed as-is in winter North Atlantic conditions, the sea state is too severe. The modal corridor, extracted from GMTDS traffic density 2011-2024, represents the route the fleet actually sails. Comparing against both avoids artificially inflating the gain with a non-sailable baseline.
Does optimized routing reduce seakeeping risk in winter?
Not on this corridor: vertical acceleration saturates on 22 of 28 departure dates, on the optimized route as well as on both baselines, making winter exposure structurally unavoidable. Routing reduces crossing time, not seakeeping risk.
What data window does this study use?
Wind and waves from ERA5, currents from CMEMS, across 28 exploitable departure dates between February 15 and March 15, 2024. The window is bounded by the CMEMS currents archive, which ends in December 2025.