
By Matthieu Caillaud · Founder, oceanographer
A wave model that has never been checked against an independent measurement is not reliable — it is a hypothesis. Before basing a weather window or a design threshold on a significant wave height (Hs) reanalysis, we audited it against two independent judges — eleven satellite altimetry missions and the CANDHIS buoy network operated by Cerema — across three corridors. The result is not a single score: it is a map of what can be trusted, and what cannot.
Why audit a wave model before relying on it
ERA5 (ECMWF) and MFWAM (Copernicus) produce a significant wave height at every point, every hour, going back decades. That is what makes them indispensable for sizing a cable-lay operation or deciding a weather window. It is also what makes them dangerous to take at face value: a 0.5° reanalysis grid does not necessarily "see" the coastline, and a systematic bias of a few tens of centimetres shifts the exceedance probability of an operational threshold.
We built a four-phase audit across three corridors — the English Channel (cable corridor), the Gulf of Lion, and the Raz de Sein — covering 2010 to 2026, with a structural gap between 2021 and 2022: the multi-year archive for some Copernicus missions ends in June 2019, and the near-real-time (NRT) archive starts later. This gap cannot be filled with current Copernicus products — we flag it rather than interpolate over it silently.
Phase 1 — Jason-3 against ERA5, over the Channel
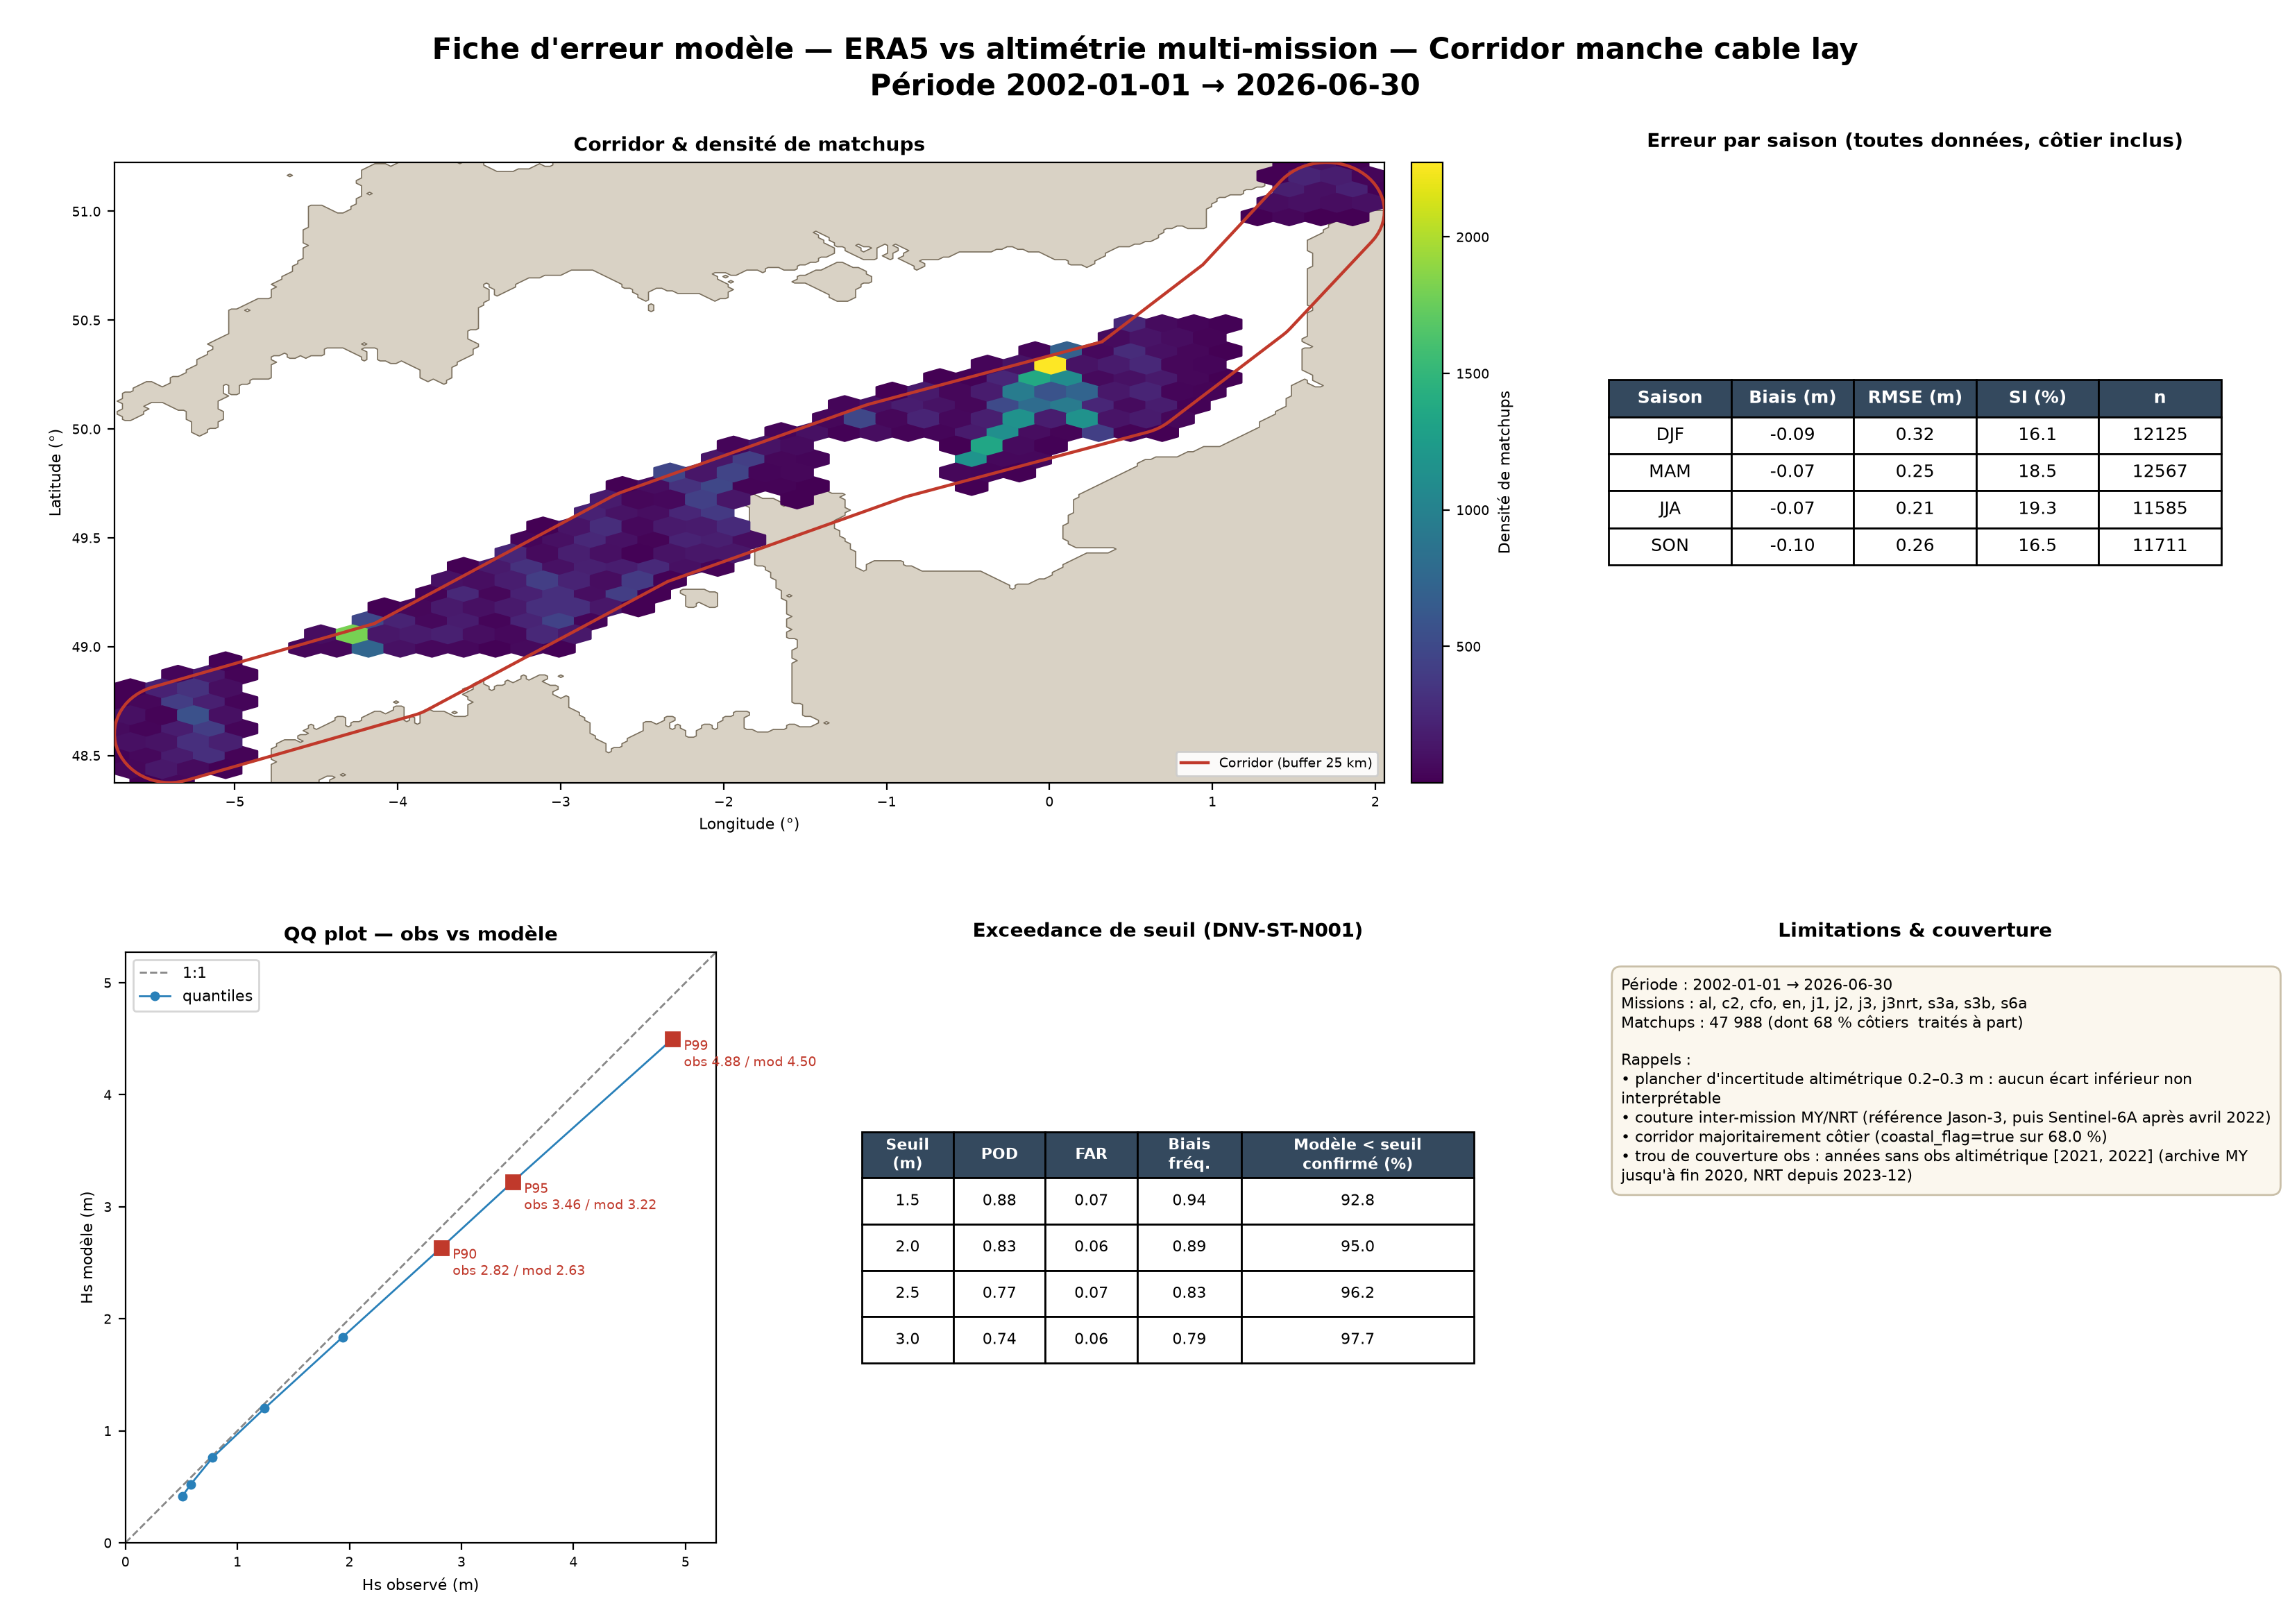
First judge: the Jason-3 altimeter, compared point by point against ERA5 over the Channel corridor. The global bias is −0.066 m, for an RMSE of 0.332 m and a scatter index (SI) of 17.6%. This global figure hides a heterogeneity worth naming:
- Open water (32.4%, n = 7,848)
- Bias −0.057 m, RMSE 0.287 m, SI 15.6%.
- Coastal zone (67.6%, n = 16,432)
- Bias −0.072 m, RMSE 0.359 m, SI 19.2%.
Two-thirds of the matchups over the Channel are coastal — precisely where nadir altimetry itself loses quality near land. Treating this population separately, rather than diluting it into a single global average, is what makes the number usable.
The seasonal RMSE is tight: 0.345 m in winter (DJF), 0.343 m in spring (MAM), 0.283 m in summer (JJA), 0.343 m in autumn (SON) — summer is the only season clearly apart, consistent with calmer seas. The most operationally useful signal comes from the QQ-plot: it shows tail compression. ERA5 underestimates extremes above roughly 2 m Hs — exactly the range that triggers standard operational thresholds.
Phase 2 — eleven missions, to check the bias is stable
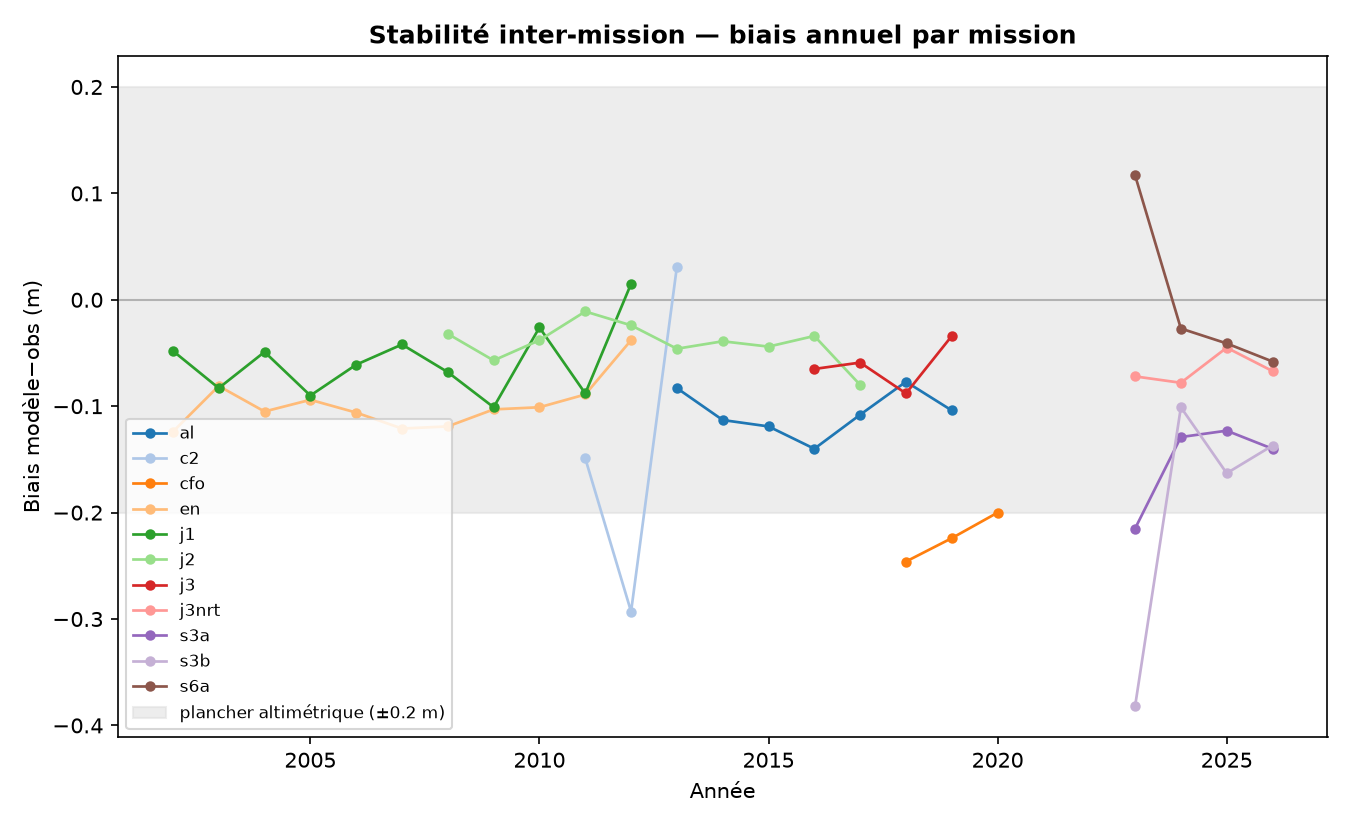
A bias measured on a single mission says nothing about its stability: is it specific to the sensor, or structural in the model? We extended the comparison to eleven altimetry missions (Jason-3, Sentinel-3A, Sentinel-3B, Sentinel-6A, SARAL, CryoSat-2, and earlier missions) over the Channel. Inter-mission bias differences range from 0.04 to 0.13 m — consistently below the altimetric uncertainty floor itself, 0.2 to 0.3 m.
Operational conclusion: there is no differential bias between missions, so no per-sensor recalibration is needed. The MY-to-NRT archive transition — from Jason-3 to Sentinel-6A, in April 2022 — does not break bias stability despite the change of platform. One exception to note: CryoSat-2 is only usable over 2010–2013 (n = 101) before its switch to SAR mode, which changes the nature of the measurement.
Phase 3 — three corridors, one starting assumption contradicted
Extending the audit to the Gulf of Lion and the Raz de Sein produces two notable findings. First, ERA5's 0.5° resolution is too coarse for the Gulf of Lion — a corridor where bathymetry and coastline vary at a scale the grid does not capture. Second, and this contradicts our starting assumption: the Raz de Sein is not the worst-performing corridor. We expected a narrow, exposed passage to penalise the reanalysis the most; the comparisons do not show that.
Over that same Raz de Sein, MFWAM (Copernicus, 0.083° resolution, roughly 9 km) offers a finer alternative, but with a short time window: November 2022 to June 2026, with only four near-real-time missions available over that period. The finer resolution therefore comes at the cost of a history reduced to 3.6 years.
Phase 4 — CANDHIS buoys as a third judge
Satellite altimetry measures along a ground track, at a given instant. Cerema's CANDHIS network — around a hundred coastal buoys spread along the French coastline — measures at a fixed point, continuously. It is a judge of a different nature, which is what makes it a complementary test rather than a redundant one.
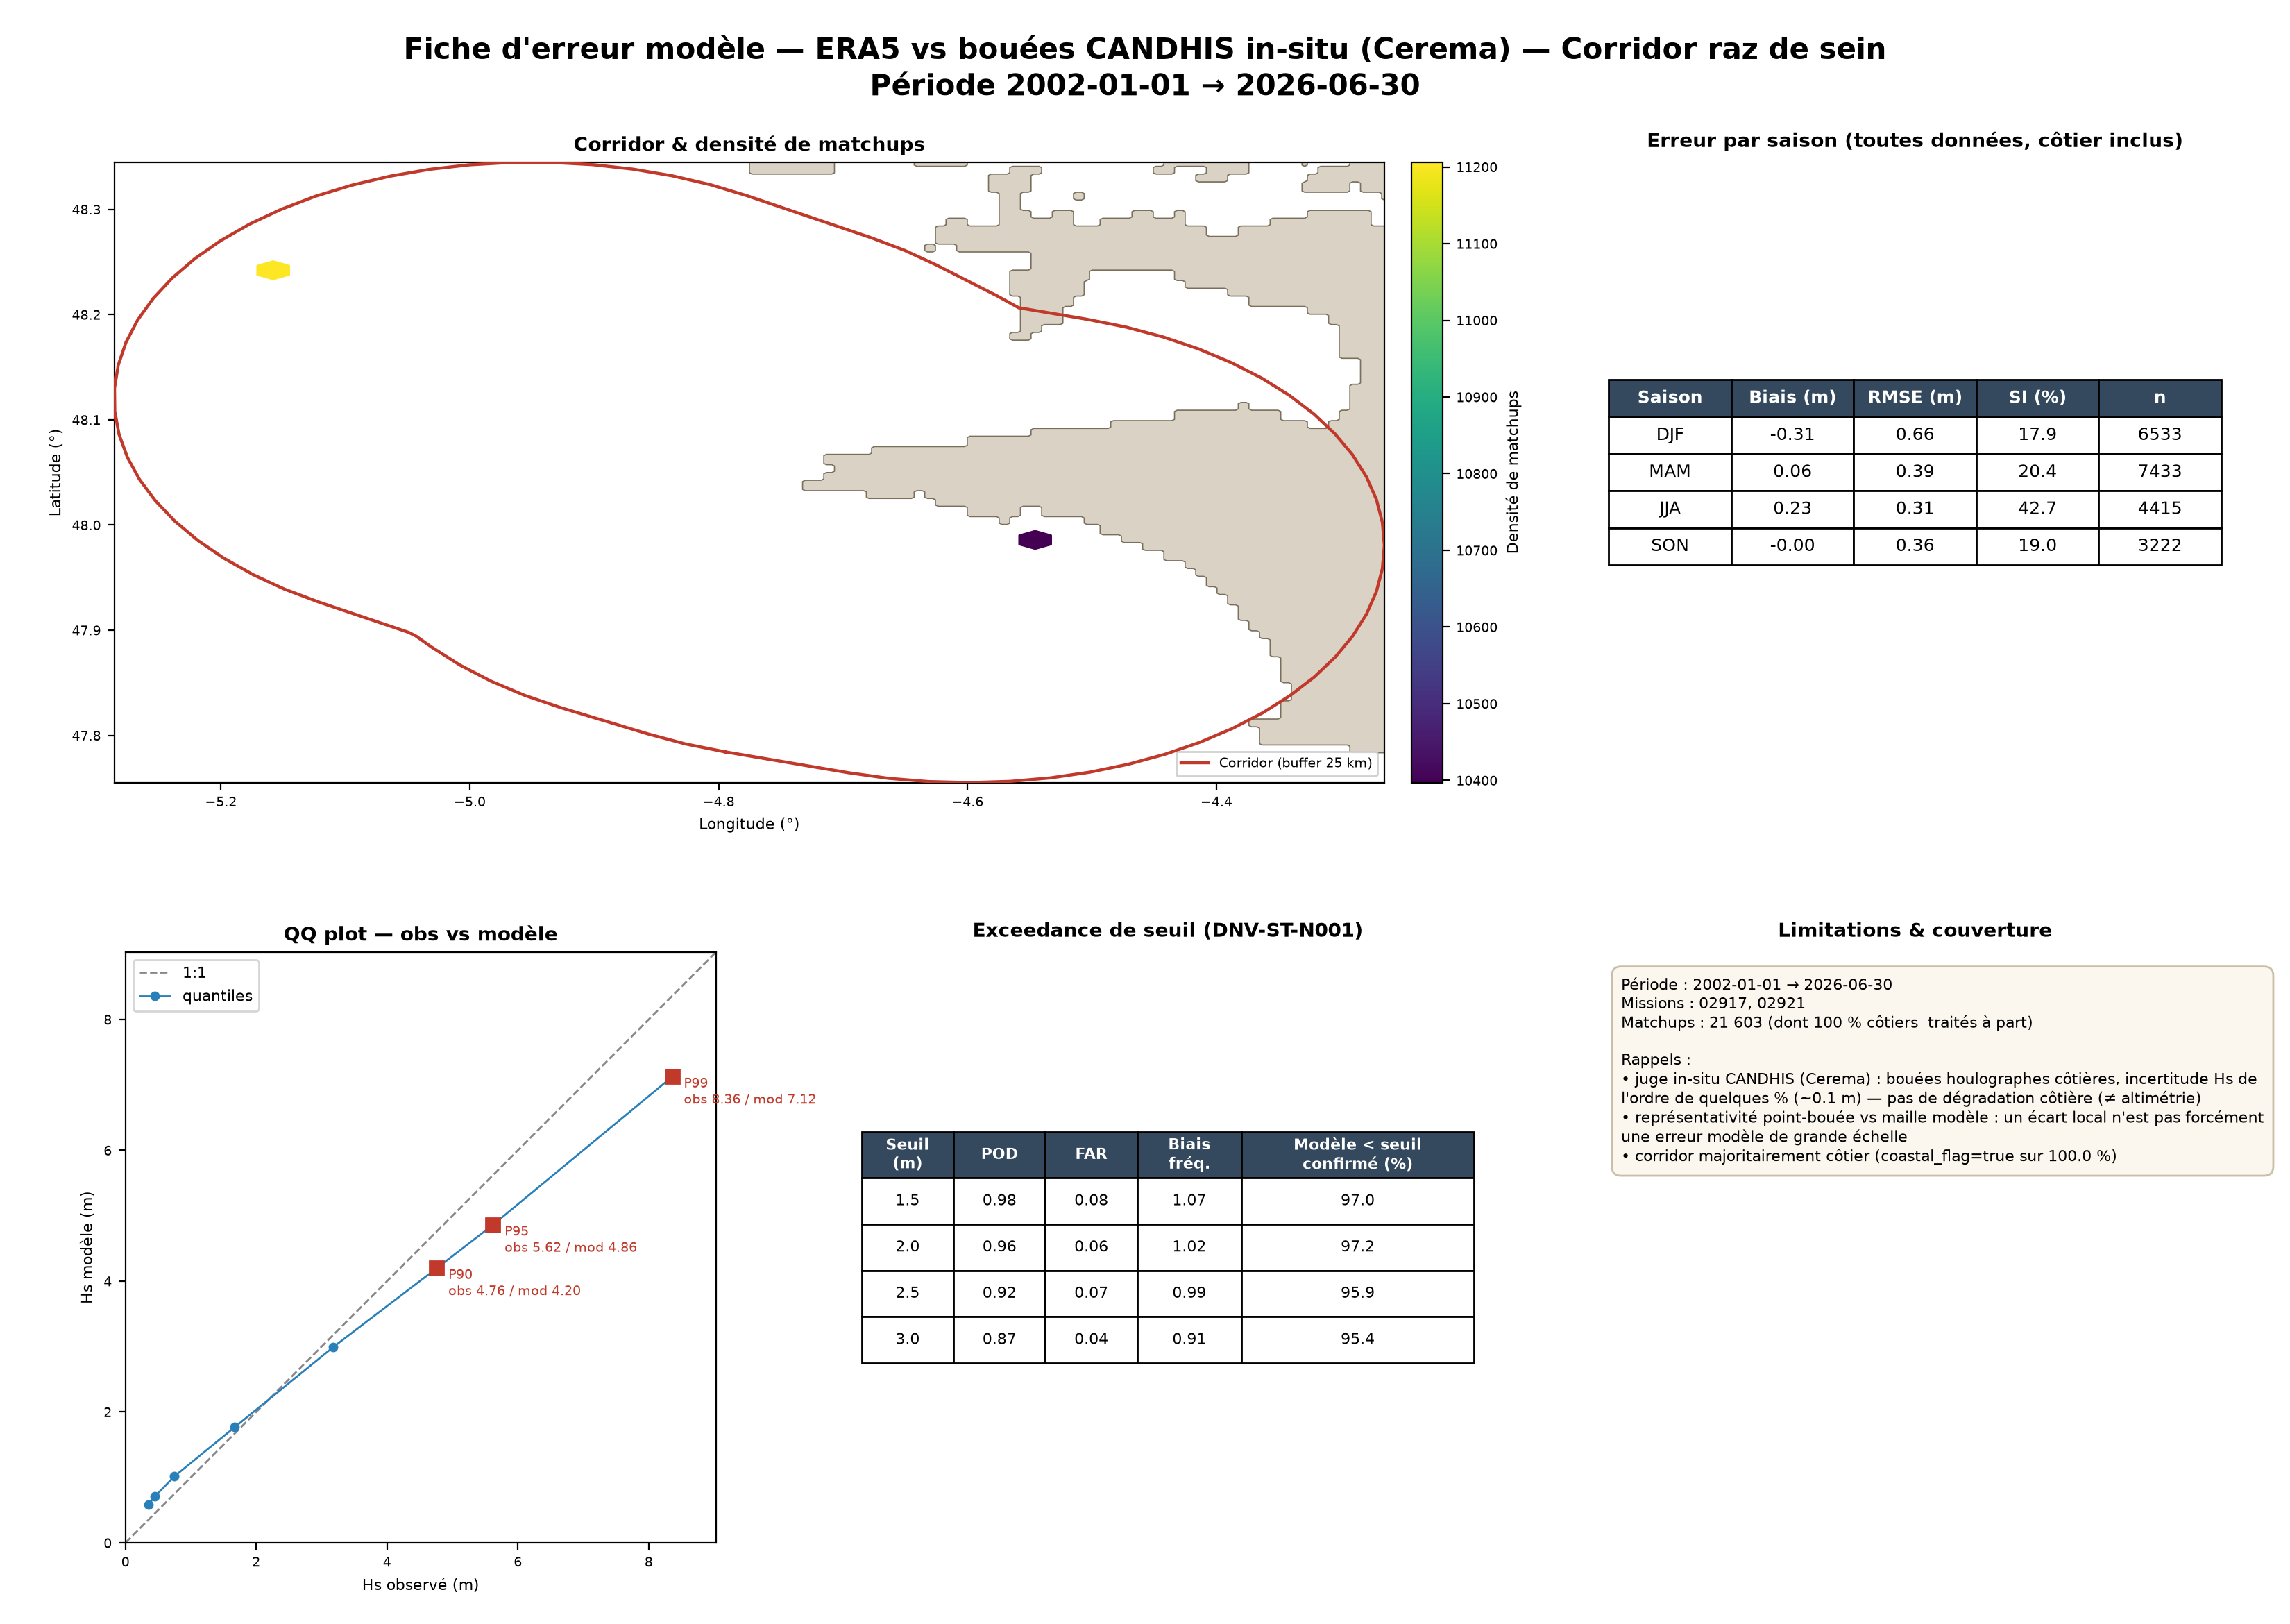
Over the Raz de Sein, comparing ERA5 against altimetry near a dozen CANDHIS stations yields 21,603 matchups, for a mean Hs of 2.20 m — consistent with the phase 3 findings.
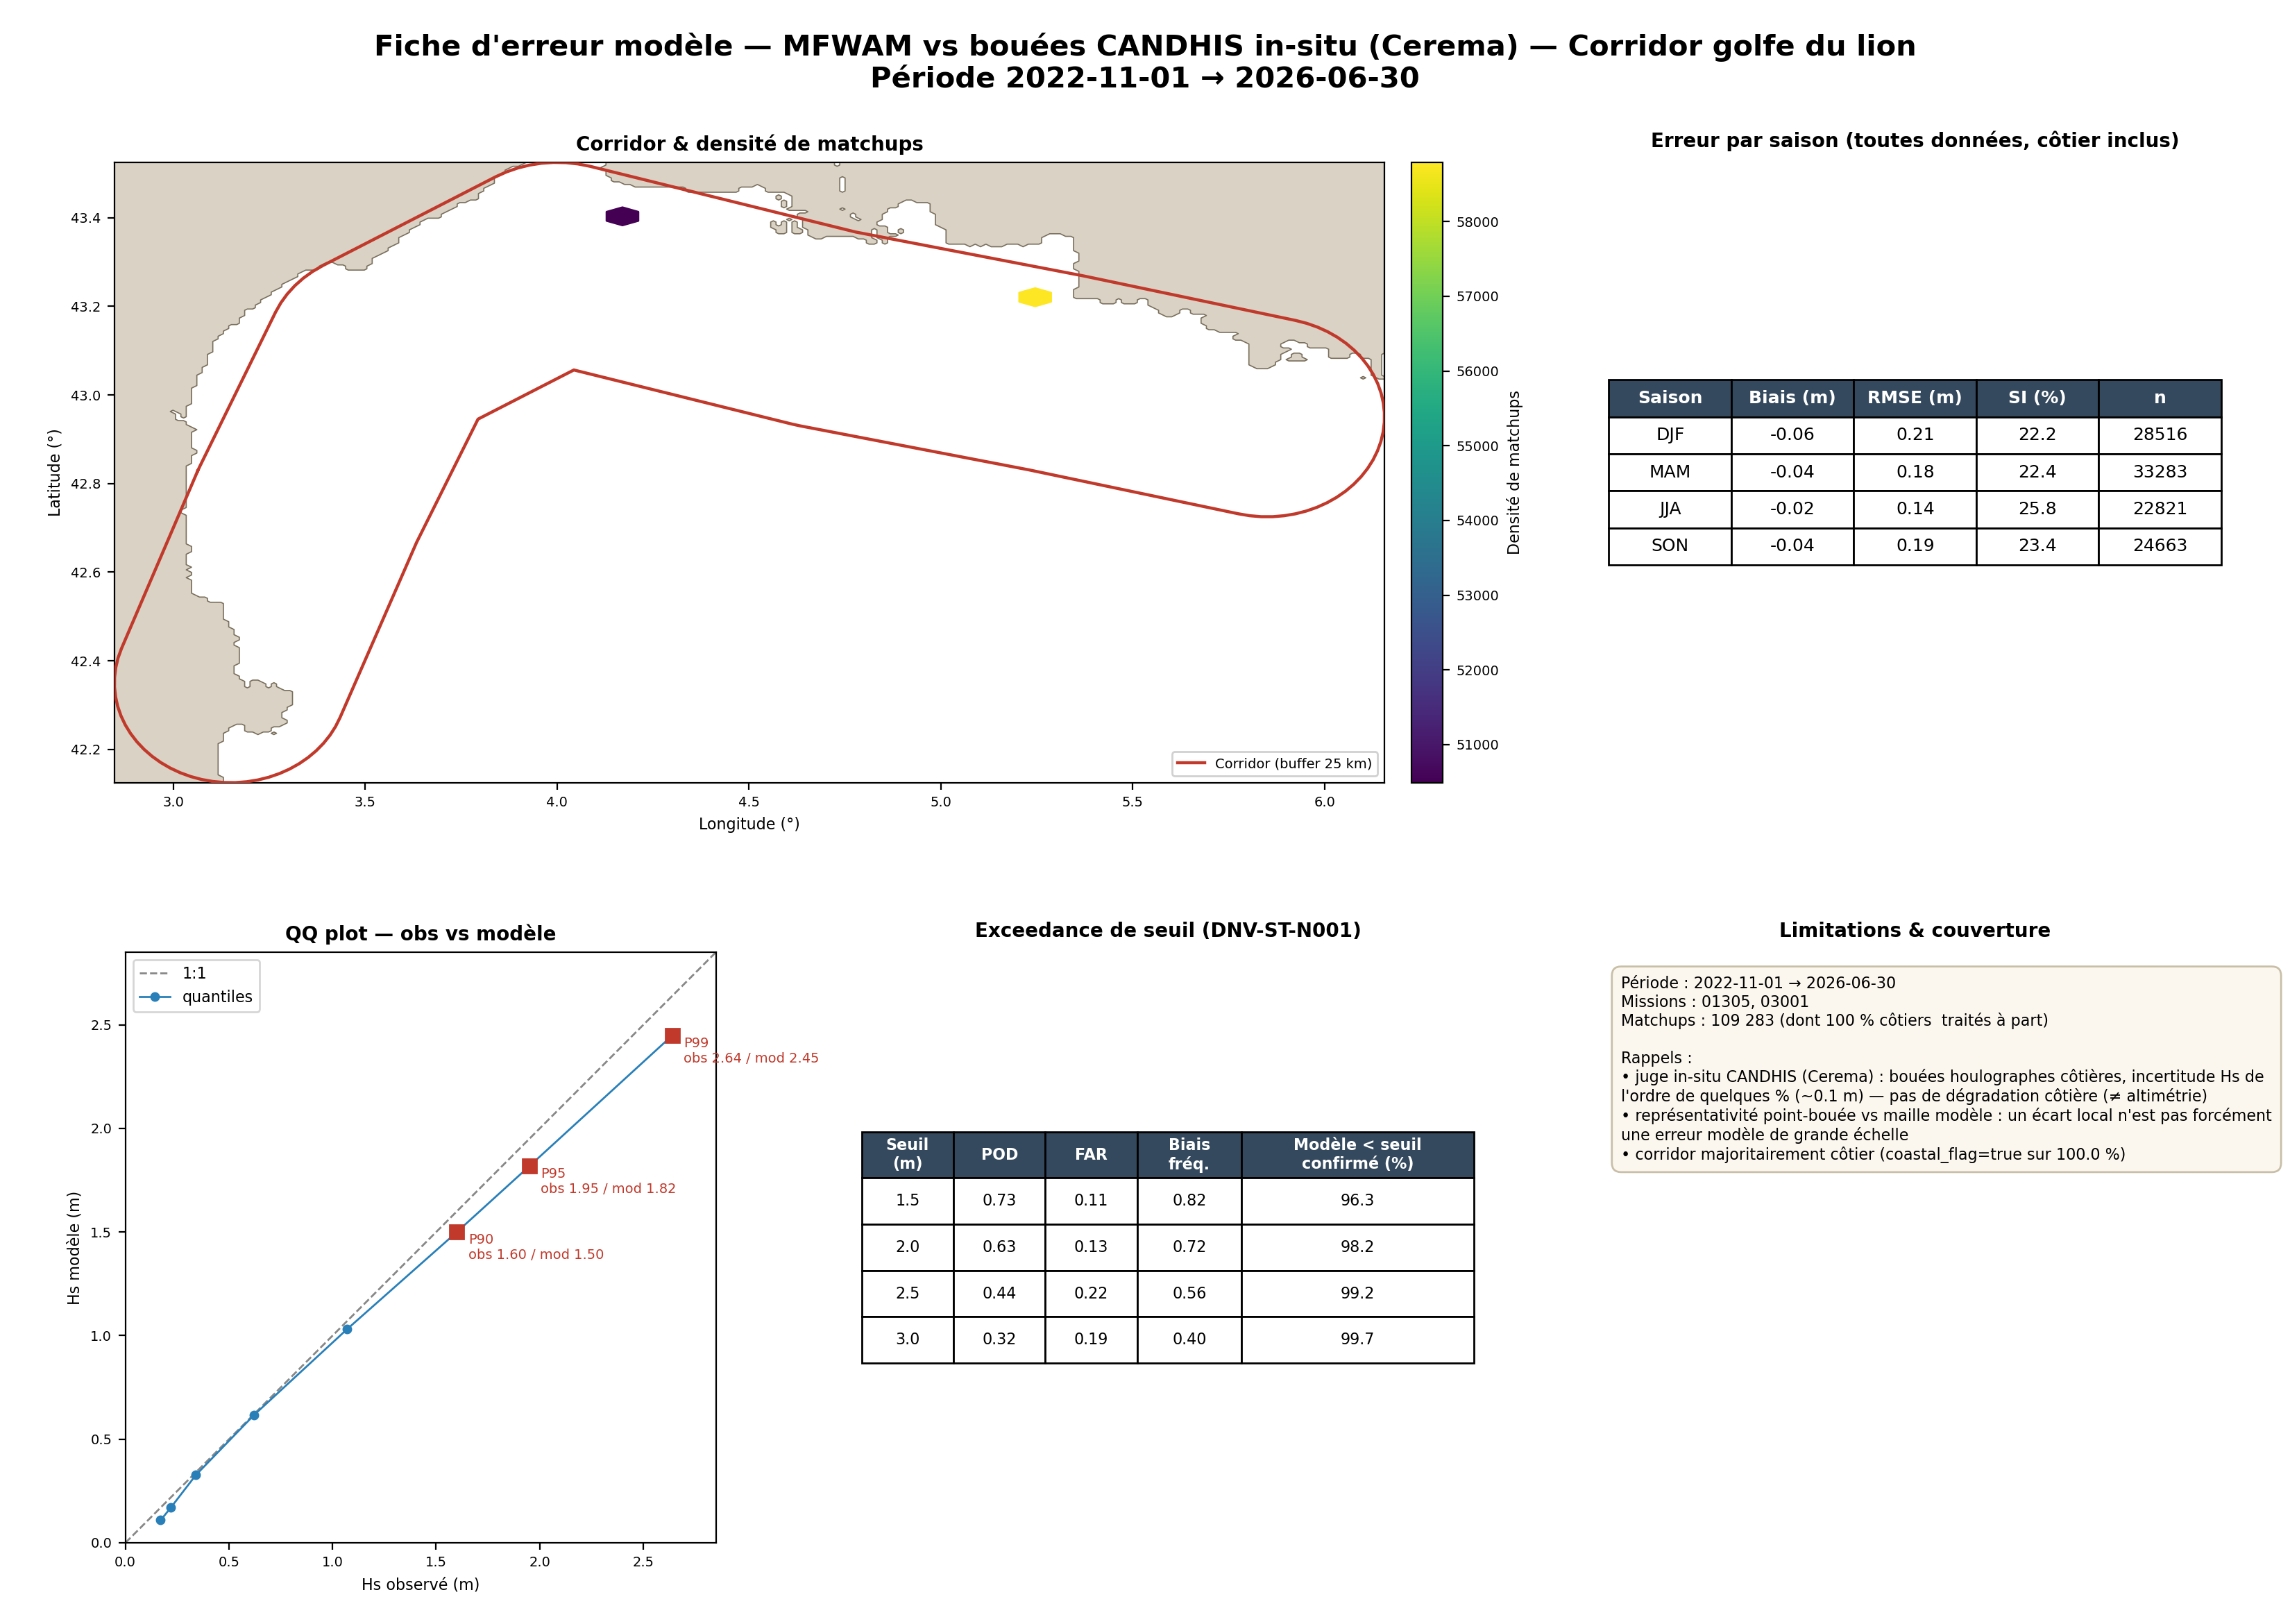
The most important result of this phase is an instructive failure, not a number: over the Gulf of Lion, all ten CANDHIS buoys fall into cells that ERA5 masks as land, due to its 0.5° grid. Validation is simply impossible there with ERA5 — this is not a question of model quality, it is a resolution problem that blinds the model exactly where the instruments sit. Switching to MFWAM puts four of the ten buoys — notably Le Planier and Espiguette — back at sea and makes them comparable: 109,283 matchups over January 2022 to June 2026, for a bias of −0.043 m, an RMSE of 0.183 m, and an SI of 23.3%.
What the audit changes, and what it does not claim
Three reading caveats apply, and we publish them alongside the numbers rather than in a footnote:
- Bias differences of 0.04 to 0.13 m between missions, as in phase 2, are below the uncertainty floor of altimetry itself (0.2–0.3 m): they should not be read as real model error.
- Nadir altimetry degrades near coasts: 67.6% of the Channel matchups are coastal and must be read separately from open water, never blended into a single average.
- The MFWAM archive spans only 3.6 years, and a CANDHIS buoy measures at a point while a model averages over a grid cell: the two judges complement each other, neither replaces the other.
The audit does not say "the model is good" or "the model is bad." It says where it is usable — the mobility frequency signal from phase 1 holds, the inter-mission stability from phase 2 holds — and where it is structurally blind, such as a 0.5° grid that places ten buoys on dry land. It is this reliability map, not a single average, that belongs in a weather window or a design threshold.
Sources and references
The metrics, comparisons and maps specific to this article are OceanData Consulting results and calculations; the links below document the datasets, standards and publications used.
Facing a similar modeling or metocean data challenge?
From physical model calibration to operational AI post-processing, we help turn marine observations into validated, decision-ready forecasts.
Frequently asked questions
Why compare a wave model against eleven different altimetry missions?
A bias measured on a single mission does not tell you whether it is sensor-specific or structural in the model. Over the Channel, bias differences across the eleven missions range from 0.04 to 0.13 m, all below altimetry’s own uncertainty floor (0.2–0.3 m): the bias is stable and mission-independent, including across the April 2022 MY-to-NRT transition from Jason-3 to Sentinel-6A.
Is ERA5 usable everywhere to validate buoy measurements?
No. Over the Gulf of Lion, all ten CANDHIS buoys fall into cells ERA5 masks as land, due to its 0.5° resolution. Validation is structurally impossible there with ERA5; switching to MFWAM (0.083°) puts four buoys back at sea and enables 109,283 matchups.
Is the Raz de Sein the worst-performing corridor for ERA5 accuracy?
No, and this contradicts the starting assumption: among the three audited corridors (Channel, Gulf of Lion, Raz de Sein), the Raz de Sein is not where ERA5 performs worst, despite its exposure and narrow configuration.