
By Matthieu Caillaud · Founder, oceanographer
We spent twelve months measuring what weather routing actually saves on Norwegian short-sea vessels, by replaying their real voyages under historical weather. The fleet verdict is inconclusive, and that is the verdict we are publishing. We will not publish a retro-routing gain percentage, because the number that survives our methodological tightening is smaller than the error of the model that produced it. This article explains how the apparent gain fell from +7.01% to +0.98%, and why every decimal point lost along the way was an artefact.
The result: +0.98% median gain against 6.17% residual error
The reference campaign covers the Bodø–Tromsø corridor from December 2023 to November 2024, based on public AIS data from Kystverket. The audited pool holds 265 voyages across 14 vessels, drawn by stratified selection from 3,139 voyages and 671 MMSI extracted over the period, of which 246 vessels had at least four voyages. Forcing combines 8,784 hours of merged ERA5 with daily CMEMS TOPAZ4 currents. The A* grid resolution is 0.1°.
- Median fleet time gain
- +0.98%, bootstrap 95% CI [+0.40; +1.73]
- Median residual model error
- 6.17%
- Conclusive voyages
- 41 out of 265, or 15.5%
- Annual fleet verdict
- inconclusive
The confidence interval excludes zero, so a systematic positive gain does exist. But that gain is roughly six times smaller than the residual error of the model measuring it. A gain below model error is not a gain; it is a quantity the instrument cannot separate from its own noise. The gain-to-error ratio is 0.16. Nothing in that number can be sold as time or fuel savings.
One point of vocabulary, because it governs everything else: on this campaign, the 6.17% residual error is no longer an error left over "after bias correction". Median per-vessel bias, in absolute value, has fallen to 2.26%, absorbed upstream by the regression-based calm-speed estimator. What remains is the true noise floor of the engine on this corridor. More calibration will not reduce it.
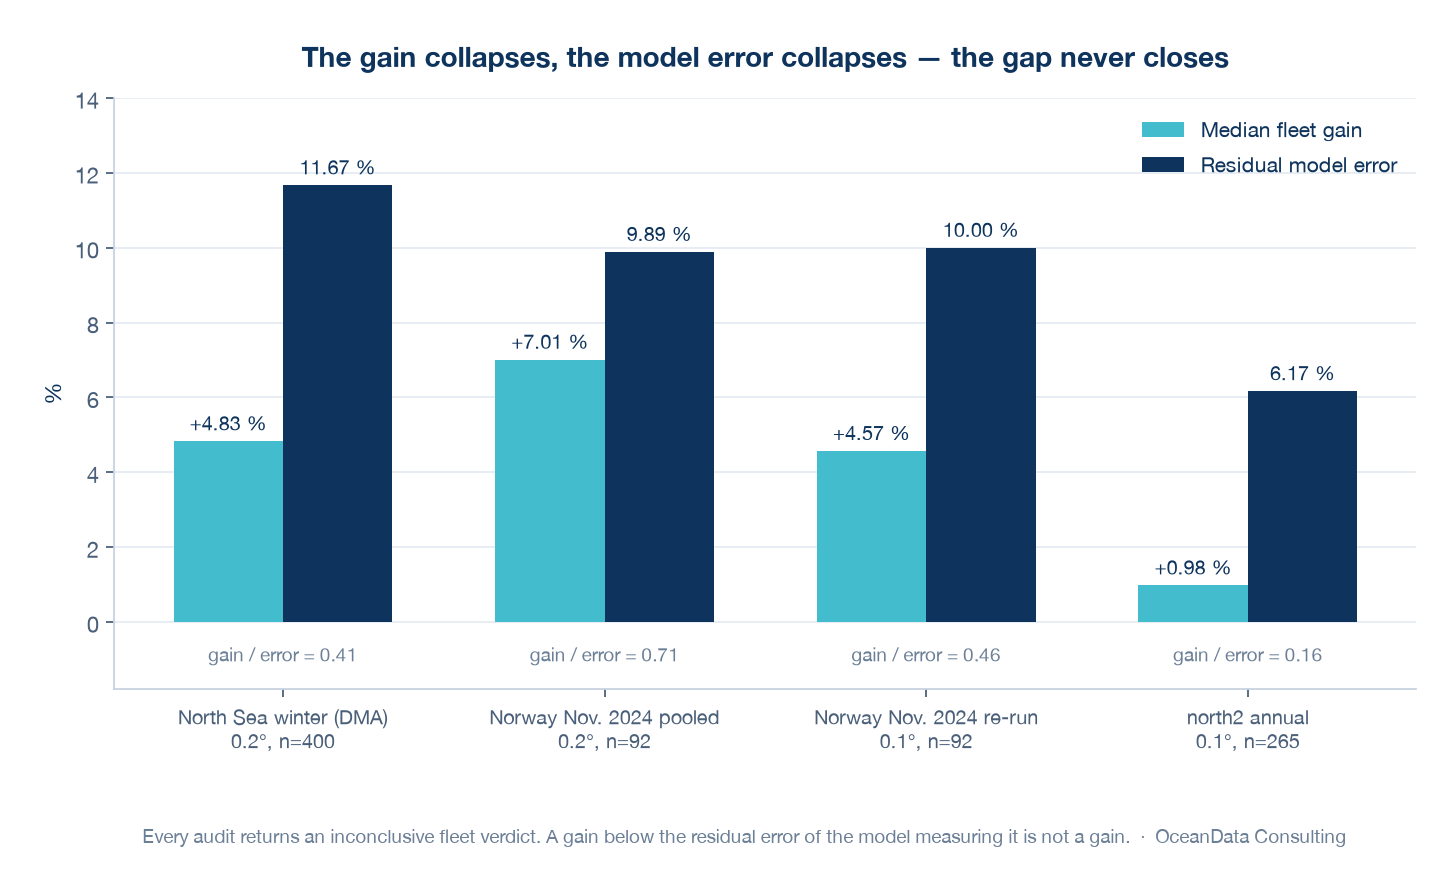
The trajectory: +7.01% to +4.57% to +0.98%
The heart of this article is not the final figure but the path to it. Three successive audits, on the same engine and on data of the same nature, produced three very different gains. Nothing new and favourable entered between them — only tighter method.
- North Sea, winter, 6 months, 0.2° grid
- 400 voyages, median gain +4.83% CI [+4.27; +5.49], residual error 11.67%, inconclusive.
- Norway, November 2024, 4 corridors, 0.2° grid
- 92 voyages, median gain +7.01% CI [+4.32; +9.67], residual error 9.89%, inconclusive.
- Same voyages replayed on a 0.1° grid
- 92 voyages, median gain +4.57% CI [+2.77; +7.62], residual error 10.00%, inconclusive.
- Annual campaign, corridor 2, 0.1° grid
- 265 voyages, median gain +0.98% CI [+0.40; +1.73], residual error 6.17%, inconclusive.
Each tightening ate part of the gain. Moving from a 0.2° to a 0.1° grid on its own brought the pooled gain from +7.01% down to +4.57%: at 0.2°, the A* search cuts across headlands inside fjords and builds routes no real vessel can follow. What that produces is not a routing gain, it is a geometry gain. Per-vessel leave-one-out debiasing, a per-voyage adequacy guard and the exclusion of non-measurable gains took the rest.
The most instructive case is the one we called the "star vessel" internally. It showed a +14.9% median gain on the coarse grid. On the finer grid it fell back to +2.6%. There never was a "+7% routing gain" on this corridor; there was +7% of grid and selection artefact.
Two movements happened at once, both in the methodologically right direction. The gain collapsed, and model error collapsed too, from 11.67% to 6.17%. That is the campaign's real progress, and it is technical rather than commercial. But the gap between the two never closed: the improvement in the model was more than offset by the disappearance of artefactual gains.
What exactly we measure, and what the measurement forbids
A gain figure only means something if you know what it compares. Four guarantees frame this one, and each closes a door through which a flattering number could have walked in.
- Model-versus-model gains, never model-versus-reality. The gain compares two runs of the same engine under the same forcing: the route actually sailed and the optimised route. Vessel speed bias cancels to first order. In exchange, this is not a measured operational saving, and we never present it as one.
- A solve is accepted only if its result carries outcome == "success". A failed solve never becomes a 100% gain, which is the most banal way of manufacturing imaginary savings.
- A per-voyage adequacy guard: the individual verdict is conditioned on model error against the real track and on grid snapping at the endpoints. A voyage the model cannot reproduce cannot yield a publishable gain.
- A plausibility guard at 25%: beyond that, in short-sea traffic, a gain reflects a routing defect and never a saving. This guard caught 8 voyages, 3.0% of the pool, spread over 5 vessels. Without it, those voyages would have come back as conclusive and pulled the fleet median up artefactually.
The fleet synthesis is a bootstrap over voyages with a measurable gain. That word does all the work: the set includes negative gains and gains below model error, and excludes only invalid replays, missing routes, endpoint snaps and implausible gains. In other words, we exclude what we cannot measure, never what we would rather not see. That is the difference between a methodological guard and cherry-picking.
The only discriminator that holds: distance
We were looking for an eligibility criterion. The obvious starting hypothesis was weather severity: routing ought to pay more in heavy weather. This audit does not confirm it. Median winter gain is +0.59% against +0.67% in summer, with heavily overlapping confidence intervals; the seasonal maximum falls in autumn, not winter.
A severity effect does exist in the pooled analysis — the heavy-weather quartile returns +2.71% against +0.07% for the calm quartile — but it collapses as soon as you look inside a single vessel. Centring gain and maximum significant wave height per vessel, the slope drops to +0.064 points of gain per metre of Hs. What the pooled analysis showed as a weather effect is very largely a vessel effect: the vessels exposed to heavy weather are also the ones sailing the long legs.
And it is leg length that carries the signal.
- Short voyages, under 150 nm
- 188 voyages, median gain -0.16%, 95% CI [-1.15; +0.32], residual error 7.44%
- Long voyages, 150 nm and over
- 77 voyages, median gain +3.55%, 95% CI [+2.62; +5.37], residual error 5.39%
On short-sea legs, routing does not beat the master; at the median it loses. The gain only appears beyond roughly 150 nautical miles — and even there, at +3.55% against 5.39% error, it stays under the model's noise floor. It is the segment closest to tipping over, not a conclusive one. The 150 nm threshold is a qualification criterion, not a promise of gain.
One conclusive vessel, three with significantly negative gains
The per-vessel distribution says more than the fleet median. Of the 14 audited vessels, exactly one is individually conclusive: 20 voyages, 19 measurable, median gain +3.79% against a residual error of 2.39%, the lowest of the set, at a median distance of 159 nm. It is the only breakdown in the whole campaign where residual error drops below the median gain. We present it as a proof of concept and never as an average: the upper bound of its confidence interval reaches +13.88%, betraying a very wide distribution, and 8 of its 20 voyages still fall below model error.
At the other end, three vessels show a significantly negative gain — a 95% confidence interval entirely below zero: -3.60%, -5.62% and -6.26%, for residual errors of 6.0%, 8.6% and 5.8%. All three run short legs, with median distances of 98 to 100 nm. They replicate a counter-example already observed in the November 2024 audit on a fourth vessel, stable across both grid resolutions. So it was not a corridor singularity, it is a regime: on those rotations the crew beats the optimiser, in a statistically defensible way.
That leaves the technical losses. 25.3% of voyages dropped out of the bootstrap because their gain was not measurable: 16.6% with no route found, 5.7% endpoint snap, 3.0% implausible gain, and no invalid replays at all. Those losses are not diffuse, they concentrate on 4 vessels. Excluding those four, the rate falls to 5.2% — and the fleet verdict does not move: +1.27% against 6.17% error, still inconclusive. We flag the defect because it makes two vessels out of fourteen entirely un-auditable, and because it sits in the land mask and fjord bathymetry, not in grid resolution.
Why we publish a negative verdict
Publishing +7.01% would have been easy. The figure existed, computed on real data, with a confidence interval excluding zero. All it required was to leave the grid coarse, skip per-vessel debiasing, drop the per-voyage model-error guard and keep the non-measurable gains in. Each of those four decisions cost gain, and each was the right decision.
What we can state comes down to three points, none of them a savings percentage. First, on this corridor and these rotations, routing does not save time, and we can demonstrate it vessel by vessel. Second, there is a quantified eligibility criterion, around 150 nm, that qualifies or disqualifies a fleet segment from a single AIS query. Third, model quality genuinely improved, from 11.67% to 6.17% median residual error, with near-zero per-vessel bias.
What we cannot state is just as clear. There is no publishable fleet gain figure on this corridor. There is no seasonal argument. The single conclusive vessel is a case, not a class. And a selection of 14 vessels out of 671 MMSI represents the corridor's high-frequency operators, not the corridor as a whole. Add that the ERA5 reanalysis describes conditions as they were experienced, not the information available on the bridge at decision time: this is a trajectory audit, not a decision audit.
We would rather publish that verdict. A consultancy that only shows its favourable results gives you no way to judge its favourable results.
The replay method underpinning this audit is described in our replay of 800 AIS voyages, and the in-house routing engine used for both exercises is presented on the SeaRoute-Py page. Wondering whether routing can pay on your own fleet? The answer starts with an AIS query on your rotation distances, not with a percentage.
Sources and references
The metrics, comparisons and maps specific to this article are OceanData Consulting results and calculations; the links below document the datasets, standards and publications used.
Facing a similar modeling or metocean data challenge?
From physical model calibration to operational AI post-processing, we help turn marine observations into validated, decision-ready forecasts.
Frequently asked questions
Does weather routing save time on short-sea shipping?
On this twelve-month campaign (265 voyages, 14 vessels, a Norwegian corridor, Kystverket AIS data), the median fleet gain is +0.98 % with a 95 % CI of [+0.40; +1.73], against a residual model error of 6.17 %. The gain is roughly six times smaller than the error measuring it: the fleet verdict is inconclusive.
Above what leg length can routing pay off?
Distance is the only discriminator that survives the audit. Under 150 nm the median gain is -0.16% (188 voyages, 95% CI [-1.15; +0.32]); at 150 nm and above it is +3.55% (77 voyages, CI [+2.62; +5.37]) - still below that segment’s 5.39% residual error. It is a qualification criterion, not a promise of gain.
Why can an announced routing gain collapse when the method is tightened?
Because high gains are often artefacts. The trajectory runs from +7.01% (0.2 degree grid) to +4.57% (same voyages at 0.1 degree) and then +0.98% (annual, fine grid, stratified selection). At 0.2 degree the A* search cuts across headlands in fjords and produces a geometry gain, not a routing gain. The star vessel at +14.9% fell back to +2.6% on the grid change alone.